MREA released a map today that illustrates inequity in school funding will go down dramatically over the next two years as a result of legislative, school board and voter decisions in 2013 and 2014. A thumbnail is below. View the interactive map.
Fixing the Donut Hole
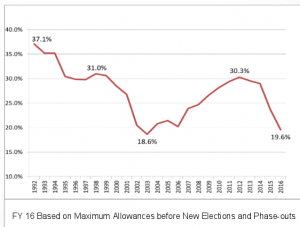
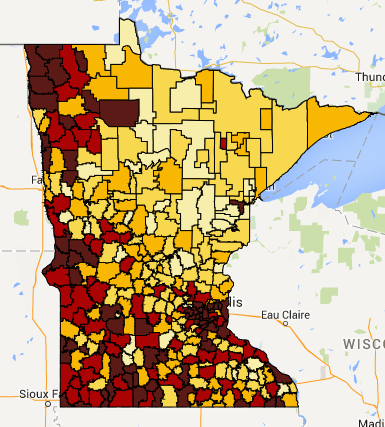 The 2012 gap in funding between the 5th to 95th percentiles of school district reached 31.5 percent. At that time, 37 districts certified zero dollars in referendum revenue.
The 2013 Legislature approved a new $300 per pupil Board Approved Levy at a greatly increased equalization factor ($880,000 per RMV/RPU), and approved Location Equity Revenue (LER) that created an inequity between metro and rural school districts which quickly was dubbed the “Donut Hole.”
The 2014 Legislature fixed the Donut Hole with Local Optional Revenue (LOR), which allowed every school board to choose to levy up to $424 equalized at Tier II of equalization ($510,000 RMV/RPU).
Key Findings
- The levy decisions made by school boards and voters in 2014 will dramatically lower the gap in funding in FY ’16. The gap from the 5th to 95th percentiles of school districts will drop to 19.6 percent. View interactive map of Referendum and LOR per APU for FY ’16. A chart mapping the 5th to 95th trend is below.

- 88 school districts, currently with the least referendum revenue per pupil, will be able to provide more equitable opportunities for their students starting in the 2015-16 school year.
| Referendum and LOR $/APU | FY ‘2014 | FY ‘2016 |
| Zero $/APU | 37 districts | 0 districts |
| $1-$285/APU | 18 districts | 0 districts |
| $300-$723/APU | 59 districts | 36 districts |
| $724/APU or more | 218 districts | 296 districts |
| Median Referendum and LOR/ADM | $867/ADM | $942/ADM |
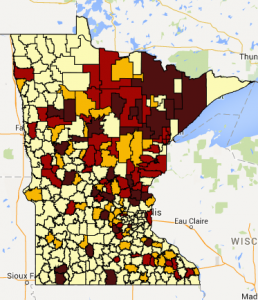 View an interactive map of school districts with new revenue for FY ’16 as a result of school board action. A thumbnail is to the right.
Further evidence that the inequity in school funding will go down in FY ’16 is that the median referendum and LOR increased only $75 or 8.6 percent despite the dramatic improvement for 78 school districts.
Note: Referendum Allowances and LOR are now calculated in dollars per APU—Adjusted Pupil Units. The FY ’16 median Referendum and LOR per APU is $860. The average per APU is $1,090.
Next Steps
- School districts need to keep their public informed of the high valued uses of these new revenues both to thank them and maintain trust.
- The Legislature and Governor need to carefully monitor the levels of referendum equalization and household income to be sure that ability to pay adequate school revenue at the local level is maintained. View an interactive map of household income by district.
- The Legislature and Governor need to address the Facility Fallout which is a similar inequity in school funding for facility maintenance and for building new facilities. Learn more.