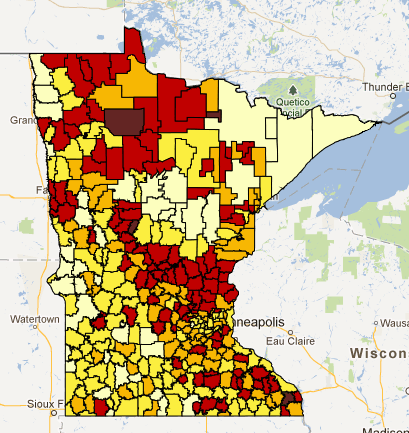
MREA released a map today on the Adjusted Net Tax Capacity (ANTC) per ADM.This map paints a complex picture on where the most inclusive measure of property value per ADM is. View the interactive map. See more maps.
 Here are some key findings:
- The rapidly increase Ag land values are having an impact in rural districts with smaller ADM’s.
- The Central Lakes and Arrowhead areas have among the highest values per ADM.
- The lowest values per ADM are exclusively in rural Minnesota.
- The Twin Cities are uniformly average or above average in value per ADM.