MREA released a map today of the Minnesota Department of Education’s 5th to 95th Percentile Funding Report. This map shows the inequities in funding based on Basic Formula, Equity Aid and Voter Approved Referendums. View the interactive map.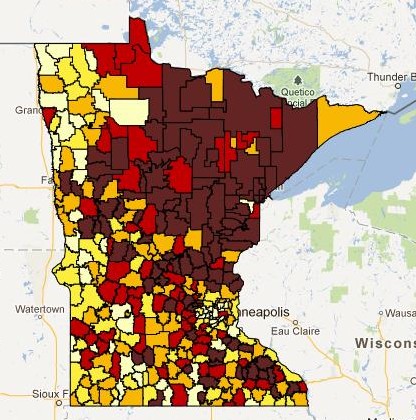
Of the three formulas included in this statutorily required report, the voter approved referendum has the largest impact on disparities in funding.
- 94 districts (28% of the total) are in the bottom 20% of funding
- 99.4% of the districts in the bottom 40% of funding are in Greater Minnesota
- All Twin Cities districts, except St. Paul, are in the average to above range in funding
- Western and Southern rural districts are a mixed bag
The 5th to 95th gap is 30.3%, the largest it has been since 1999.