A map created and released by MREA today shows where voters have approved referendums across the state. The map visually represents voter approved operating referendum dollars per resident for AMPCU Pay 2013. A thumbnail is available below. View the interactive map. 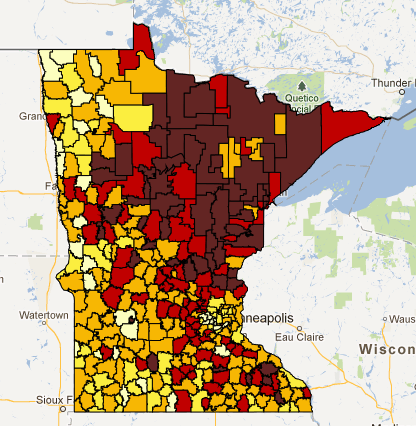
The map reveals the lowest voter approved referendums in the North Central and northeastern areas of the state.
Key findings include:
- 54 districts have less than $300 per ADM
- 37 districts have $0 per ADM
- $936 is average Ref per Resident AMPCU’s for Districts with Referendums
The highest voter approved referendums are in the Western and Southern Twin Cities suburbs and in small rural districts. View the interactive map.