MREA released a map today that reveals voter approved referendums masking the effects of special ed cross subsidies. Voter approved referendums are mitigating the effects of special ed cross subsidies. A thumbnail of the map is below. Click here to view the interactive map.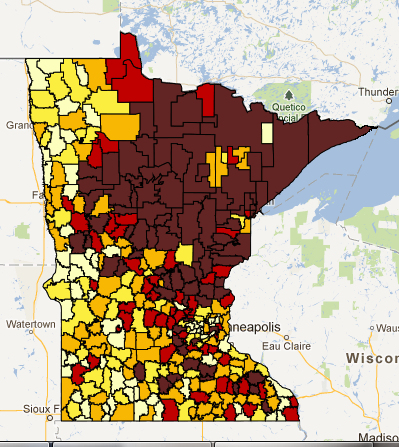
The ability of communities to approve operating referendums coupled with special ed cross subsidies creates geographic inequities.
Key findings include:
- 96% of the 70 districts with zero to $400 Operating Referendum had net less than the basic formula $5224 per pupil with the cross subsidy factored in
- Most of these districts are in Central and Northern Minnesota
- 99% of the 215 districts with more than $650 Operating Referendum had more than the basic formula even with the cross subsidy factored in
- Nearly all of these districts are in the Twin Cities and smaller western and southern rural district.
The map is illustrative only because the cross subsidy $’s are from 2010 and the operating referendum $’s are from FY’14.
View the interactive map to see the impact on your district and region.